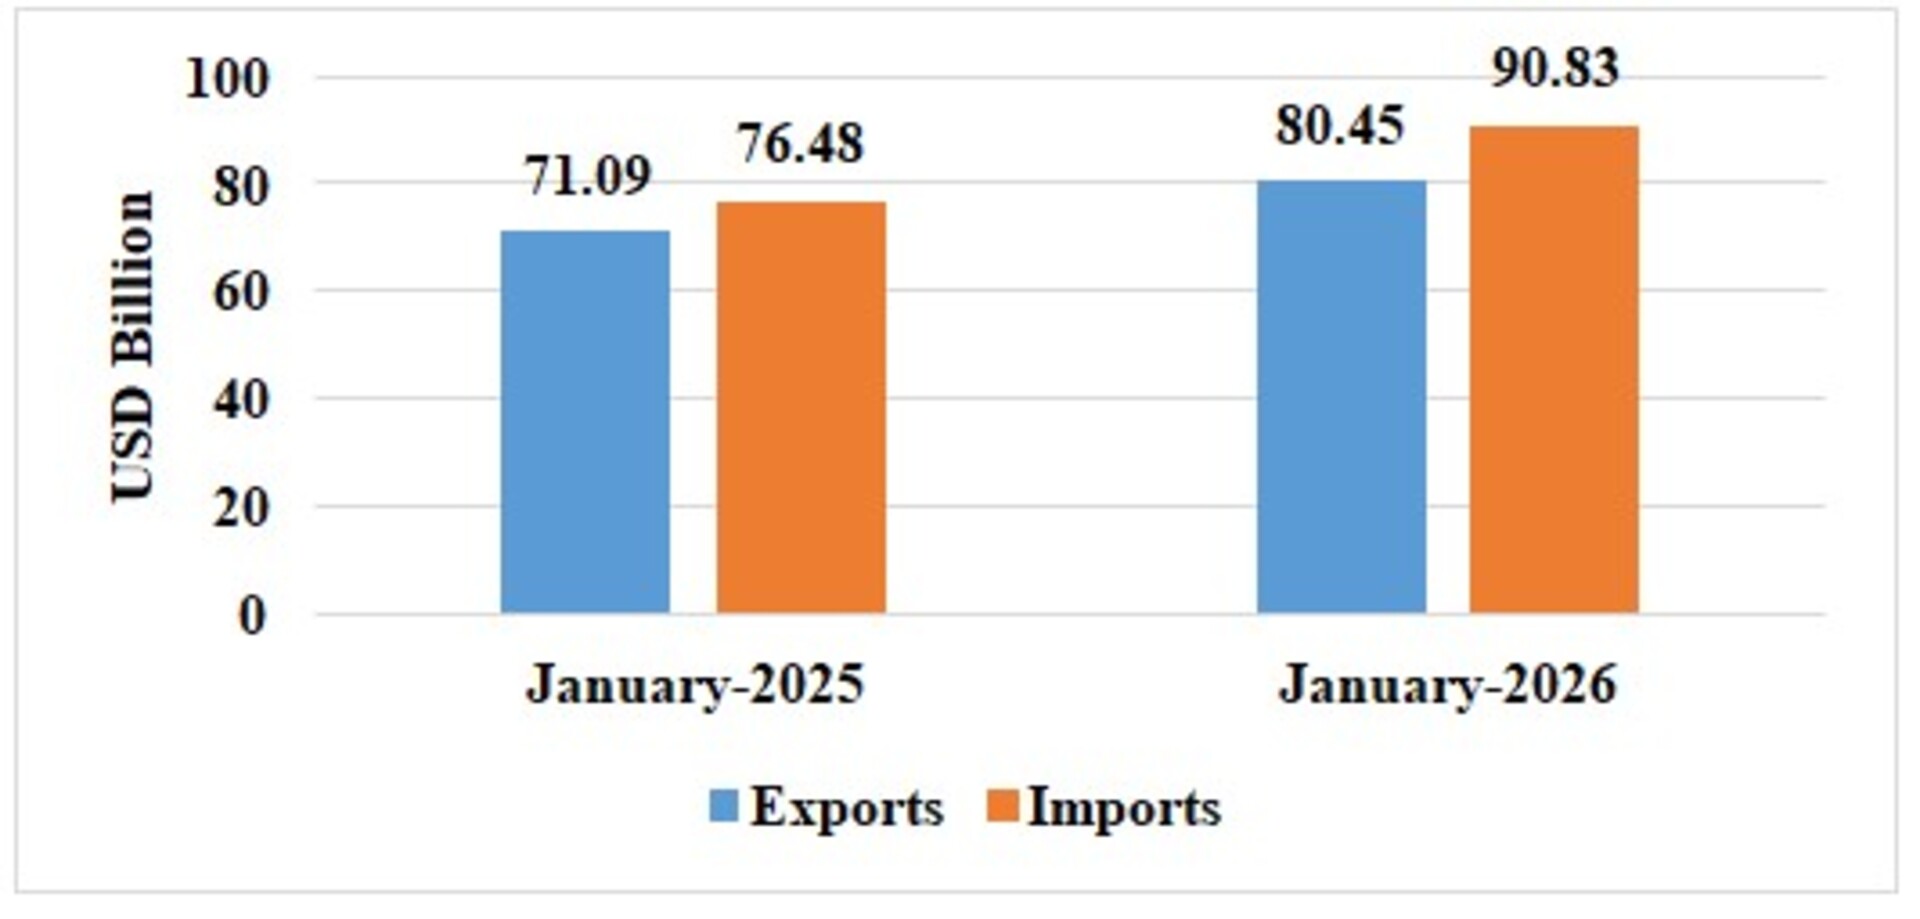
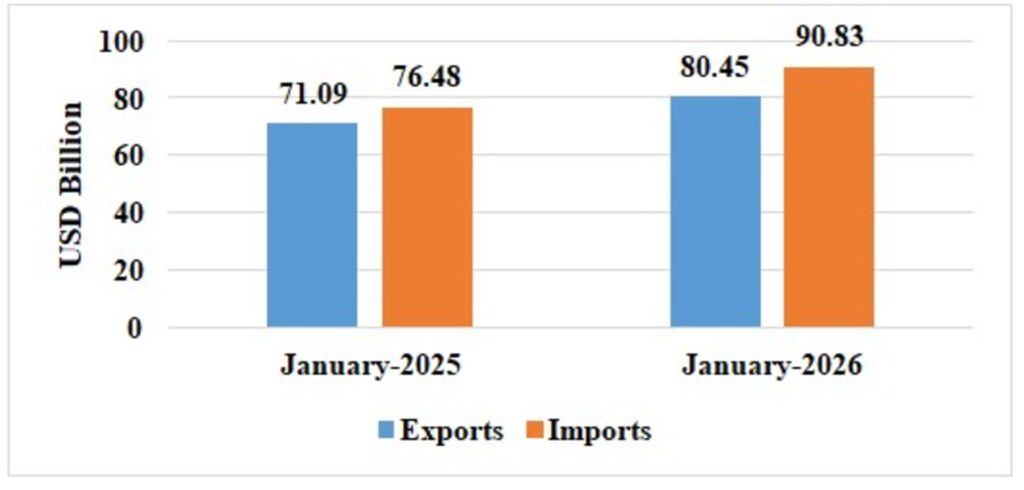
- India’s total exports (Merchandise and Services combined) for January 2026* is estimated at US$ 80.45 Billion, registering a positive growth of 13.17 percent vis-à-vis January 2025. Total imports (Merchandise and Services combined) for January 2026* is estimated at US$ 90.83 Billion, registering a positive growth of 18.76 percent vis-à-vis January 2025.
Table 1: Trade during January 2026*
| January 2026(US$ Billion) | January 2025(US$ Billion) | ||
| Merchandise | Exports | 36.56 | 36.34 |
| Imports | 71.24 | 59.77 | |
| Services* | Exports | 43.90 | 34.75 |
| Imports | 19.60 | 16.71 | |
| Total Trade(Merchandise +Services) * | Exports | 80.45 | 71.09 |
| Imports | 90.83 | 76.48 | |
| Trade Balance | -10.38 | -5.39 |
* Note: The latest data for services sector released by RBI is for December 2025. The data for January 2026 is an estimation. (ii) Data for April-January 2024-25 and April-September 2025 has been revised on pro-rata basis using quarterly balance of payments data.
Fig 1: Total Trade during January 2026*
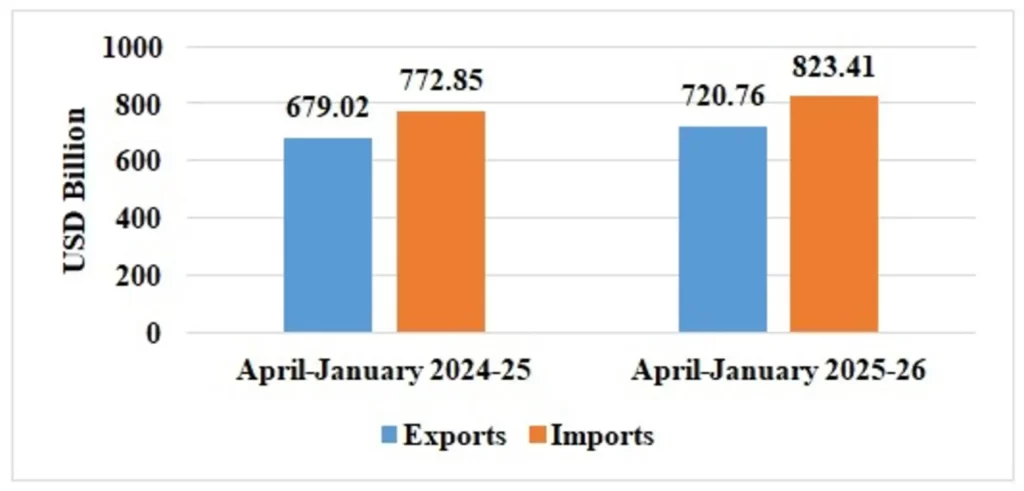
- India’s total exports during April-January 2025-26* is estimated at US$ 720.76 Billion registering a positive growth of 6.15 percent. Total imports during April-January 2025-26* is estimated at US$ 823.41 Billion registering a growth of 6.54 percent.
Table 2: Trade during April-January 2025-26*
| April-January 2025-26(US$ Billion) | April-January 2024-25(US$ Billion) | ||
| Merchandise | Exports | 366.63 | 358.75 |
| Imports | 649.86 | 606.13 | |
| Services* | Exports | 354.13 | 320.28 |
| Imports | 173.55 | 166.72 | |
| Total Trade(Merchandise +Services) * | Exports | 720.76 | 679.02 |
| Imports | 823.41 | 772.85 | |
| Trade Balance | -102.65 | -93.83 |
Fig 2: Total Trade during April-January 2025-26*
MERCHANDISE TRADE
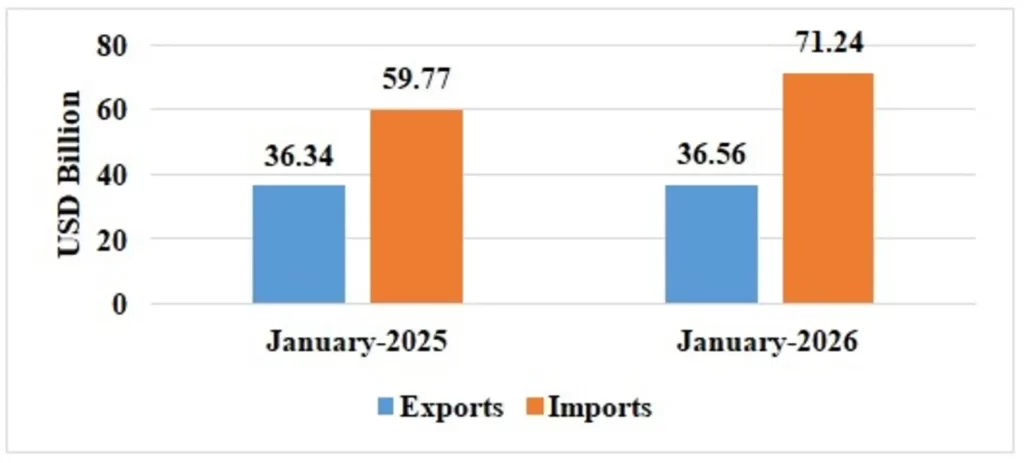
- Merchandise exports during January 2026 were US$ 36.56 Billion as compared to US$ 36.34 Billion in January 2025.
- Merchandise imports during January 2026 were US$ 71.24 Billion as compared to US$ 59.77 Billion in January 2025.
Fig 3: Merchandise Trade during January 2026
- Merchandise exports during April-January 2025-26 were US$ 366.63 Billion as compared to US$ 358.75 Billion during April-January 2024-25.
- Merchandise imports during April-January 2025-26 were US$ 649.86 Billion as compared to US$ 606.13 Billion during April-January 2024-25.
- Merchandise trade deficit during April-January 2025-26 was US$ 283.23 Billion as compared to US$ 247.38 Billion during April-January 2024-25.
Fig 4: Merchandise Trade during April-January 2025-26

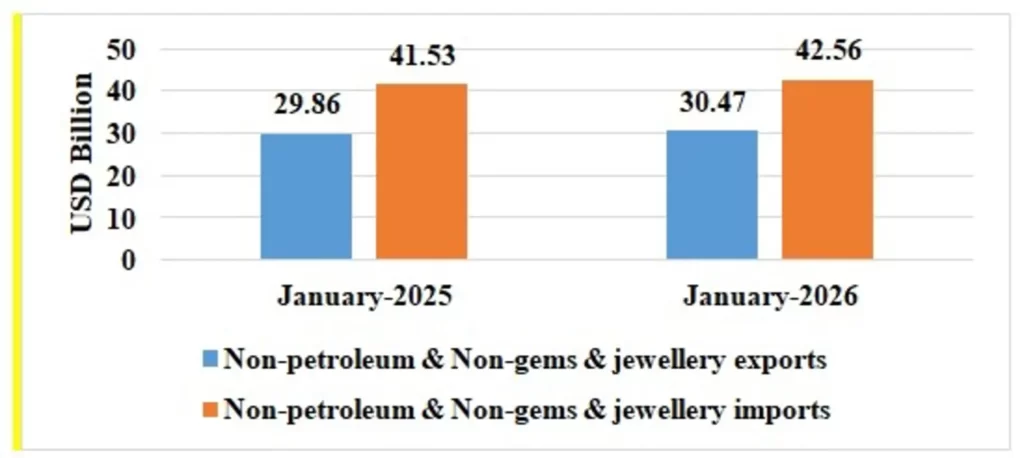
- Non-petroleum and non-gems & jewellery exports in January 2026 were US$ 30.47 Billion compared to US$ 29.86 Billion in January 2025.
- Non-petroleum, non-gems & jewellery (gold, silver & precious metals) imports in January 2026 were US$ 42.56 Billion compared to US$ 41.53 Billion in January 2025.
Table 3: Trade excluding Petroleum and Gems & Jewellery during January 2026
| January 2026(US$ Billion) | January 2025 (US$ Billion) | |
| Non- petroleum exports | 32.78 | 32.86 |
| Non- petroleum imports | 57.83 | 46.33 |
| Non-petroleum & Non-Gems & Jewellery exports | 30.47 | 29.86 |
| Non-petroleum & Non-Gems & Jewellery imports | 42.56 | 41.53 |
Note: Gems & Jewellery Imports include Gold, Silver & Pearls, precious & Semi-precious stones
Fig 5: Trade excluding Petroleum and Gems & Jewellery during January 2026
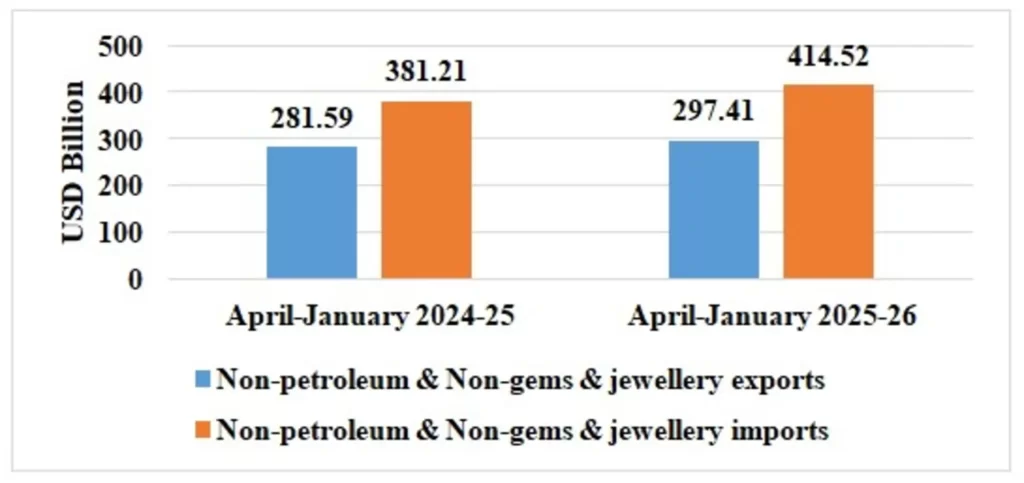
- Non-petroleum and non-gems & jewellery exports in April-January 2025-26 were US$ 297.41 Billion, compared to US$ 281.59 Billion in April-January 2024-25.
- Non-petroleum, non-gems & jewellery (gold, silver & precious metals) imports in April-January 2025-26 were US$ 414.52 Billion, compared to US$ 381.21 Billion in April-January 2024-25.
Table 4: Trade excluding Petroleum and Gems & Jewellery during April-January 2025-26
| April-January 2025-26(US$ Billion) | April-January 2024-25(US$ Billion) | |
| Non- petroleum exports | 320.94 | 305.98 |
| Non- petroleum imports | 501.04 | 451.25 |
| Non-petroleum & Non Gems & Jewellery exports | 297.41 | 281.59 |
| Non-petroleum & Non Gems & Jewellery imports | 414.52 | 381.21 |
Note: Gems & Jewellery Imports include Gold, Silver & Pearls, precious & Semi-precious stones
Fig 6: Trade excluding Petroleum and Gems & Jewellery during April-January 2025-26
SERVICES TRADE
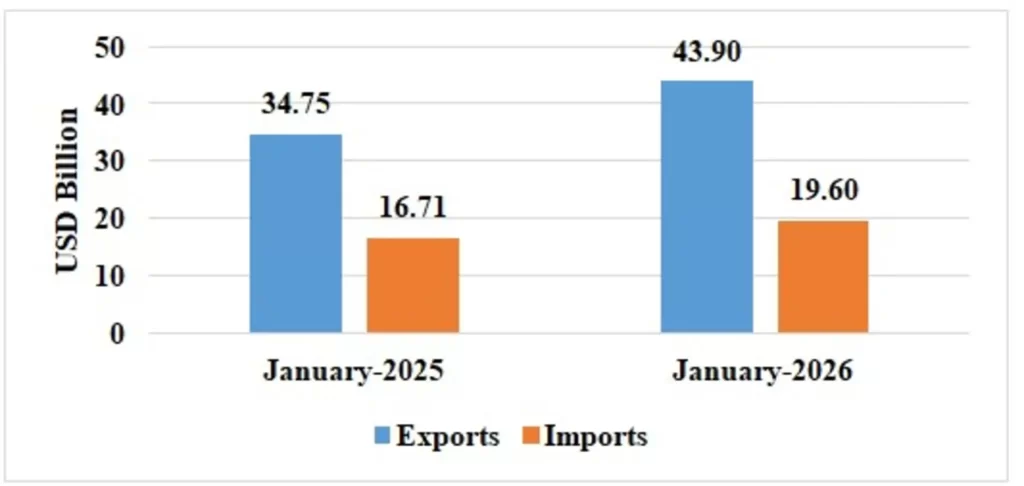
- The estimated value of services export for January 2026* is US$ 43.90 Billion as compared to US$ 34.75 Billion in January 2025.
- The estimated value of services imports for January 2026* is US$ 19.60 Billion as compared to US$ 16.71 Billion in January 2025.
Fig 7: Services Trade during January 2026*
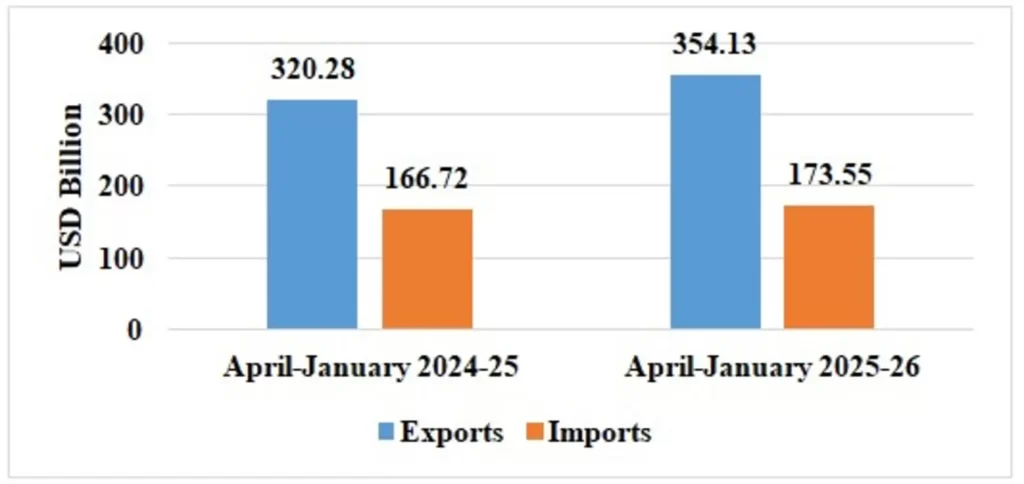
- The estimated value of service exports during April-January 2025-26* is US$ 354.13 Billion as compared to US$ 320.28 Billion in April-January 2024-25.
- The estimated value of service imports during April-January 2025-26* is US$ 173.55 Billion as compared to US$ 166.72 Billion in April-January 2024-25.
- The services trade surplus for April-January 2025-26* is US$ 180.58 Billion as compared to US$ 153.56 Billion in April-January 2024-25.
Fig 8: Services Trade during April-January 2025-26*
- Exports of Other Cereals (88.49%), Coffee (36.03%), Iron Ore (31.54%), Meat, Dairy & Poultry Products (17.92%), Marine Products (13.29%), Engineering Goods (10.37%), Petroleum Products (8.55%), Mica, Coal & Other Ores, Minerals Including Processed Minerals (6.35%), Fruits & Vegetables (1.77%), Cereal Preparations & Miscellaneous Processed Items (1.12%), Man-Made Yarn/Fabs./Made-Ups Etc. (1.01%), Drugs & Pharmaceuticals (0.96%) and Electronic Goods (0.32%) record positive growth during January 2026 over the corresponding month of last year.
- Imports of Pulses (-46.94%), Newsprint (-29.33%), Chemical Material & Products (-24.6%), Iron & Steel (-18.77%), Coal, Coke & Briquettes, Etc. (-16.56%), Project Goods (-14.78%), Wood & Wood Products (-8.35%), Organic & Inorganic Chemicals (-7.62%), Transport Equipment (-5.27%), Pearls, Precious & Semi-Precious Stones (-2.64%), Textile Yarn Fabric, Made-Up Articles (-2.41%) and Petroleum, Crude & Products (-0.24%) record negative growth during January 2026 over the corresponding month of last year.
- Services exports is estimated to grow by 10.57 percent during April-January 2025-26* over April-January 2024-25.
- Top 5 export destinations, in terms of change in value, exhibiting positive growth in January 2026 vis a vis January 2025 are U Arab Emts (29.27%), China P Rp (55.65%), Hong Kong (98.72%), Netherland (20.47%) and Italy (32.1%).
- Top 5 export destinations, in terms of change in value, exhibiting positive growth in April-January 2025-26 vis a vis April-January 2024-25 are China P Rp (38.37%), U S A (5.85%), U Arab Emts (9.56%), Spain (48.39%) and Hong Kong (30.72%).
- Top 5 import sources, in terms of change in value, exhibiting growth in January 2026 vis a vis January 2025 are Switzerland (836.85%), U Arab Emts (48.38%), China P Rp (16.67%), U S A (23.71%) and U K (75.38%).
- Top 5 import sources, in terms of change in value, exhibiting growth in April-January 2025-26 vis a vis April-January 2024-25 are China P Rp (13.82%), U Arab Emts (12.03%), U S A (13.87%), Hong Kong (27.02%) and Singapore (14.2%).